
Cybersecurity Lab: Network Traffic Detection and Analysis
Attacks hide inside ordinary-looking traffic. In this home-lab build I capture live packets, feed them through an IDS, and hunt for the tell-tale signals of an intrusion — scans, beacons, exfil — turning raw PCAPs into detections you can actually act on.
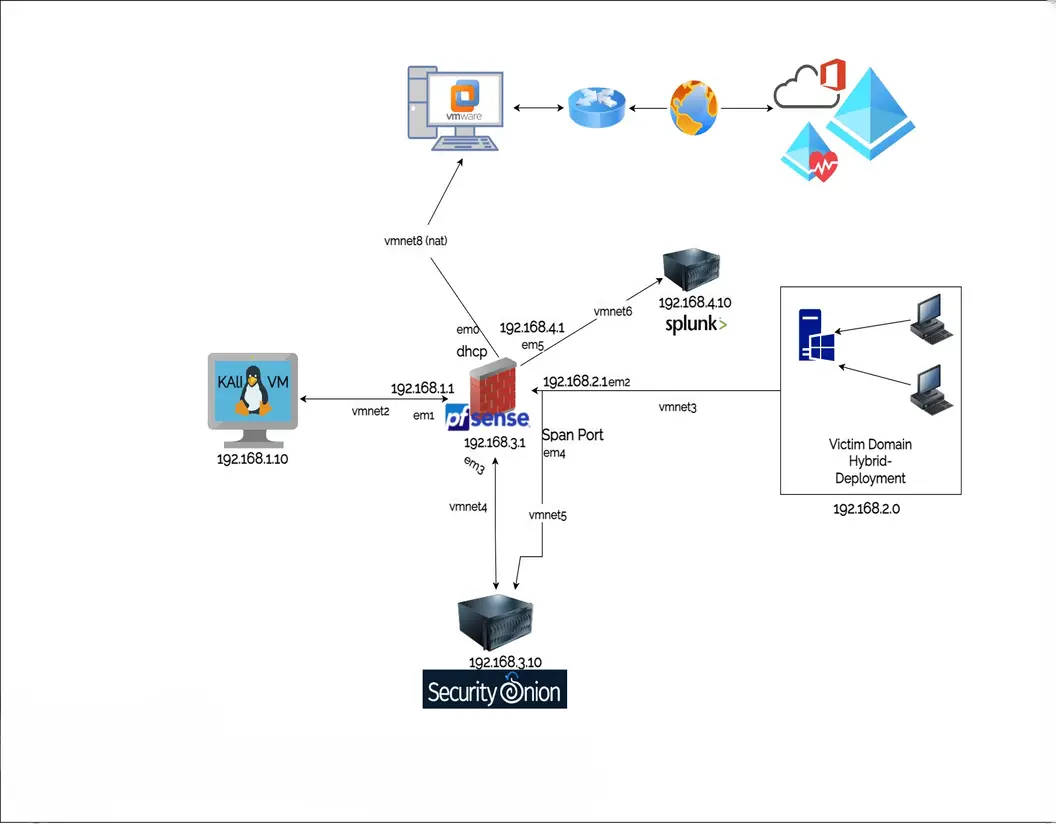
Why build a network traffic detection and analysis lab?
Diagram by Jv Cyberguard
A network traffic lab is one of the most practical ways to learn cybersecurity. It moves beyond theory and puts you in direct contact with how devices communicate, how attacks appear on the wire, and how defenders separate normal activity from suspicious behavior.
This kind of lab is valuable for several reasons:
- It teaches packet-level visibility
- It builds familiarity with common protocols
- It helps you recognize scanning, brute-force attempts, and malware-like traffic patterns
- It creates a safe environment for testing detections
- It improves incident response and troubleshooting skills
Whether your goal is blue team practice, SOC analyst preparation, or simply stronger networking fundamentals, traffic analysis is a skill that transfers directly into real environments.
Lab goals
The purpose of this lab is to capture network traffic, inspect it, and identify potentially malicious behavior using repeatable methods.
By the end of the lab, you should be able to:
- Capture live traffic from a network interface
- Apply filters to isolate relevant packets
- Identify common protocols such as DNS, HTTP, HTTPS, ICMP, SSH, and DHCP
- Detect indicators of suspicious activity
- Correlate packet evidence with system or security logs
- Document findings in a structured way
Lab architecture
A simple and effective lab can be built with only a few virtual machines and common open-source tools.
Example setup
- Analyst workstation
- Runs Wireshark and command-line tools
- Used for packet capture and analysis
- Target host
- Simulates a user or server
- Generates normal traffic such as web browsing, DNS lookups, and file transfers
- Attacker simulation host
- Used to generate controlled suspicious traffic such as port scans or failed login attempts
- Optional monitoring node
- Runs Suricata, Zeek, or tcpdump for passive monitoring
Network options
You can deploy this lab using:
- VirtualBox host-only networking
- VMware custom virtual networks
- Proxmox virtual bridges
- Docker networks for lightweight application testing
- A small physical switch with port mirroring if using real hardware
A minimal virtual layout might look like this:
[Attacker VM] ----\
                   \
                    [Virtual Switch/Bridge] ---- [Target VM]
                   /
[Analyst VM] -----/
For passive monitoring, add a mirrored interface or place a monitoring sensor on the same segment when possible.
Recommended tools
The best labs use a mix of packet capture, protocol analysis, and detection tools.
Packet capture and inspection
- Wireshark: GUI-based protocol analyzer for deep inspection
- tcpdump: Lightweight command-line capture tool
- tshark: Command-line version of Wireshark
Detection and analysis
- Suricata: Network IDS/IPS with signature-based detection
- Zeek: Network security monitoring and protocol logging
- Snort: Signature-based IDS
- Arkime: Full-packet capture and indexing for larger labs
Traffic generation and testing
- nmap: Port scanning and service discovery
- curl: HTTP/HTTPS request testing
- ping: Connectivity and ICMP behavior
- netcat: Raw TCP/UDP testing
- hydra or controlled scripts: Brute-force simulation in a safe environment only
Log correlation
- Sysmon on Windows endpoints
- journalctl or
/var/log/*on Linux - Elastic Stack, Splunk, or Graylog for log aggregation
Building the lab
1. Prepare isolated systems
Keep the environment segmented from production and personal networks.
Best practices:
- Use private addressing such as
192.168.56.0/24 - Disable unnecessary internet access if not required
- Snapshot VMs before testing
- Use non-production credentials
- Clearly label attacker, target, and analyst systems
Example host assignments:
Analyst VM   192.168.56.10
Target VM    192.168.56.20
Attacker VM  192.168.56.30
2. Install core tools
On the analyst system, install packet capture and analysis tools.
Ubuntu/Debian example
sudo apt update
sudo apt install -y wireshark tcpdump tshark zeek suricata nmap curl netcat-openbsd
RHEL-based example
sudo dnf install -y wireshark wireshark-cli tcpdump nmap curl nc
Depending on your distribution, Zeek and Suricata may require additional repositories.
3. Verify traffic visibility
Before attempting detection, confirm that your analyst or monitoring system can see traffic on the correct interface.
List interfaces:
ip addr
Capture packets on a specific interface:
sudo tcpdump -i eth0
Capture only DNS traffic:
sudo tcpdump -i eth0 port 53
Save traffic for later analysis:
sudo tcpdump -i eth0 -w lab_capture.pcap
Open the resulting PCAP in Wireshark for detailed inspection.
Establish a baseline
Detection works best when you understand what normal traffic looks like first. Generate routine traffic from the target host and observe the patterns.
Baseline activities
- DNS lookups
- Web browsing
- SSH sessions
- NTP synchronization
- DHCP lease requests
- Software update checks
- Internal file transfers
Useful test commands:
ping -c 4 192.168.56.20
curl http://example.com
nslookup example.com
ssh user@192.168.56.20
While these are running, observe:
- Source and destination IPs
- Port usage
- Protocol sequences
- Packet sizes
- Timing and frequency
Document the baseline so later anomalies are easier to spot.
Wireshark filters that matter
Wireshark filters are essential for reducing noise and focusing on relevant traffic.
Common display filters
ip.addr == 192.168.56.20
dns
http
tls
icmp
tcp.port == 22
udp.port == 53
tcp.flags.syn == 1 && tcp.flags.ack == 0
Examples of targeted analysis
Show all traffic to or from the target:
ip.addr == 192.168.56.20
Show possible scan behavior:
tcp.flags.syn == 1 && tcp.flags.ack == 0
Show DNS queries:
dns.flags.response == 0
Show HTTP requests:
http.request
Show failed TCP handshakes or resets:
tcp.flags.reset == 1
These filters help identify patterns quickly without manually scrolling through every packet.
Generate suspicious traffic safely
Once the baseline is understood, generate controlled suspicious behavior from the attacker host.
Port scan example
Run a simple SYN scan:
sudo nmap -sS 192.168.56.20
What you may observe:
- Many SYN packets to multiple ports
- Minimal follow-up traffic to closed ports
- RST responses from the target
- Fast sequential probing behavior
Service enumeration
nmap -sV 192.168.56.20
This often produces:
- Banner-grabbing attempts
- Repeated connections to common service ports
- Distinctive probe patterns
ICMP sweep behavior
nmap -sn 192.168.56.0/24
Indicators include:
- ICMP echo requests to multiple hosts
- Broad host discovery patterns
- Short bursts of similar packets
Repeated login attempts
In a controlled lab, simulate failed SSH logins to observe brute-force patterns.
Look for:
- Repeated TCP connections to port 22
- Short session durations
- High authentication failure counts in host logs
- Bursts from a single source IP
What suspicious traffic looks like
Traffic analysis is not just about identifying one packet. It is about recognizing patterns across flows, timing, and behavior.
Common indicators
- A single host connecting to many ports on one target
- One source contacting many hosts in a short period
- Unusual outbound traffic at odd hours
- Repeated DNS lookups for random-looking domains
- Unexpected cleartext protocols
- Large outbound transfers from systems that normally do not send much data
- Beacon-like regular intervals
- Connections to rare external destinations
Example: simple scan pattern
A scan often appears as:
- Source host sends SYN
- Destination replies with SYN-ACK or RST
- Source quickly moves to another port
- Sequence repeats with little application data exchanged
Example: suspicious DNS behavior
Watch for:
- High query volume from one endpoint
- Many
NXDOMAINresponses - Long or encoded subdomains
- Repeated requests to uncommon domains
- DNS requests followed by unusual outbound connections
Using Suricata for alert-based detection
Packet inspection is powerful, but alerts add scale and repeatability.
Basic Suricata workflow
Start Suricata on an interface:
sudo suricata -i eth0
Typical alert outputs are written to:
/var/log/suricata/fast.log
/var/log/suricata/eve.json
View alerts:
tail -f /var/log/suricata/fast.log
Example alert types you might see:
- Port scan signatures
- Known malicious HTTP patterns
- Protocol anomalies
- Suspicious TLS or DNS behavior
Why combine PCAP and alerts?
Alerts alone can be noisy. PCAP alone can be time-consuming. Together they provide:
- Fast initial triage
- Full packet evidence
- Better false-positive validation
- Easier analyst training
Using Zeek for network metadata
Zeek is excellent for producing structured logs from network traffic.
Start Zeek on a capture file:
zeek -r lab_capture.pcap
This can generate logs such as:
conn.logdns.loghttp.logssl.logortls.lognotice.log
Why this matters:
- You can review connection summaries quickly
- DNS and HTTP behavior become easier to search
- It helps bridge the gap between raw packets and high-level events
For example, conn.log can help identify:
- Which host initiated a connection
- How long the session lasted
- How much data was transferred
- Whether the connection completed normally
Correlating packets with endpoint evidence
Traffic analysis becomes stronger when paired with endpoint logs.
Linux examples
Review SSH authentication logs:
sudo journalctl -u ssh
Or:
sudo grep "Failed password" /var/log/auth.log
Windows examples
Useful sources include:
- Security Event Log
- Sysmon network events
- PowerShell logs
- Defender alerts
Correlation workflow
- Detect suspicious traffic in Wireshark or Suricata
- Note timestamps, IP addresses, ports, and protocol details
- Check endpoint logs for matching events
- Confirm whether the traffic reflects legitimate activity or malicious behavior
- Record the findings and evidence
This process mirrors real incident triage.
Sample detection scenarios
A good blog post or portfolio project becomes stronger when it includes concrete scenarios.
Scenario 1: Port scan detection
Action: Attacker runs nmap -sS 192.168.56.20
Expected evidence:
- Bursts of SYN packets
- Multiple destination ports
- Short-lived connections
- Suricata or Zeek notices indicating scan-like behavior
Analyst conclusion: Reconnaissance activity detected from 192.168.56.30 against 192.168.56.20
Scenario 2: Repeated SSH failures
Action: Controlled failed SSH attempts against target
Expected evidence:
- Repeated connections to port 22
- Similar timing intervals
- Authentication failure logs on the target
- Possible IDS alerts for brute-force behavior
Analyst conclusion: Credential attack simulation observed and validated with network and endpoint logs
Scenario 3: Suspicious DNS patterns
Action: Generate multiple queries to non-existent or random-looking subdomains
Expected evidence:
- High DNS request count
- Multiple failed resolutions
- Strange subdomain length or entropy
- Potential data exfiltration or tunneling indicators
Analyst conclusion: Abnormal DNS activity detected requiring deeper investigation
Practical analyst methodology
When reviewing traffic, a consistent process matters more than any single tool.
A useful workflow is:
- Identify the alert, anomaly, or investigation lead
- Determine the affected host or user
- Isolate relevant PCAP traffic
- Review protocols and session behavior
- Compare activity to the baseline
- Correlate with endpoint and security logs
- Decide whether the event is benign, suspicious, or confirmed malicious
- Write a concise investigation summary
This habit is what turns packet review into real detection capability.
Common mistakes in beginner labs
New analysts often run into the same issues. Avoiding them will save time and reduce confusion.
Typical pitfalls
- Capturing on the wrong interface
- Forgetting to establish a baseline
- Looking only at alerts and not packet contents
- Assuming encrypted traffic is invisible
- Ignoring timing and frequency patterns
- Failing to synchronize system clocks across VMs
- Testing too many scenarios at once
- Not documenting commands, timestamps, and results
A lab should be repeatable. Clean notes are just as important as clean captures.
How to document the project for a portfolio
If this lab is part of a cybersecurity portfolio, present it like a real technical case study.
Include:
- Lab objective
- Network diagram
- Tooling used
- Traffic generation steps
- Detection logic
- Screenshots of Wireshark filters or Suricata alerts
- Sample logs from Zeek or endpoints
- Findings and interpretation
- Lessons learned
- Ideas for future improvements
Example project summary
Objective: Detect and analyze reconnaissance and brute-force activity in an isolated lab.

Tools: Wireshark, tcpdump, Suricata, Zeek, nmap, Linux auth logs

Findings:
- Identified SYN scan activity from attacker VM
- Confirmed repeated SSH failures via network and endpoint logs
- Observed DNS anomalies consistent with suspicious query patterns

Outcome:
Built practical skill in packet analysis, alert validation, and event correlation.
Ideas for expanding the lab
Once the basics are working, you can make the environment more realistic.
Possible extensions:
- Add a web server with vulnerable applications for HTTP analysis
- Introduce Windows endpoints and Sysmon logs
- Export Zeek and Suricata logs into Elastic or Splunk
- Create custom Suricata rules
- Test encrypted traffic metadata analysis
- Simulate malware beacon intervals with safe scripts
- Add VLANs and routing to study east-west traffic
- Practice writing detection reports after each scenario
Final thoughts
A cybersecurity lab focused on network traffic detection and analysis is one of the best ways to develop practical defensive skills. It builds confidence with protocols, packet captures, detection tools, and investigative workflows.
The key lesson is simple: effective detection is not just about seeing packets. It is about understanding behavior, building a baseline, spotting anomalies, and validating conclusions with evidence.
If you build this lab carefully and document it well, it becomes more than a practice environment. It becomes a strong portfolio project that demonstrates hands-on cybersecurity ability in a way that employers and peers can immediately understand.
From Logs to Alerts: Getting Started with SIEM
View in portfolioMore in Cybersecurity


You might also like
Never miss a post
Get new cybersecurity and networking write-ups straight to your inbox. No spam — unsubscribe anytime.