From Logs to Alerts: Getting Started with SIEM
How a Security Information and Event Management platform turns raw noise into actionable detections — and how to start with Splunk.
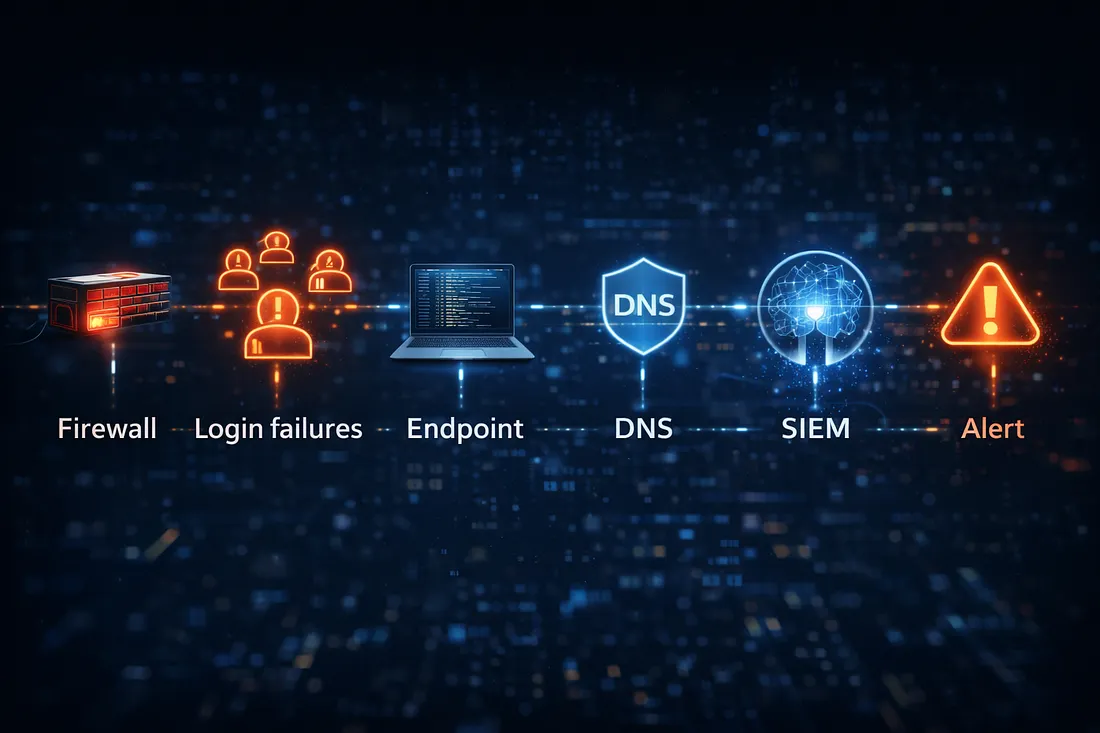
A SIEM is where all your telemetry comes together — firewall logs, endpoint events, authentication records — so you can correlate them and detect what no single source could reveal on its own.
The mental model
Think of a SIEM in three layers:
- Collection — ship logs from every source into one place.
- Normalization — parse them into a common schema so a "user" means the same thing everywhere.
- Detection — write searches and rules that fire when something looks wrong.
Your first Splunk search
Once data is flowing, start simple. Find failed logins and look for spikes:
index=auth action=failure
| stats count by user, src_ip
| where count > 10
That single search surfaces brute-force attempts against any account.
Tune relentlessly
The enemy of a good SIEM is alert fatigue. Every alert you keep should be one you would actually act on. Prune the rest, document your logic, and revisit it monthly.
Good detection is not about more alerts — it is about the right alerts.
Start with a handful of high-value detections, get comfortable investigating them end to end, and grow from there.